Financial Summary
2009 and 2010 began the road to recovery after the dramatic downturn in the economy and the financial markets in late 2007 and into 2008.
The S&P 500 index was up 26.47 percent in 2009, while the Barclay’s Aggregate index of fixed income generated a return of 5.93 percent. The markets recouped some of the losses endured between October 2007 and the end of 2008, when the S&P 500 fell by 41.7 percent.
Like the broader markets, the Cleveland Foundation’s investment portfolio regained some, but not all, of its lost value. During 2009, the foundation’s composite return was 21.95 percent. That outperformed the 18.36 percent median composite return among institutional investors. It also outpaced a blended portfolio of 70 percent equities and 30 percent fixed income, which would have returned 20.31 percent.
Our assets increased in 2009 from $1.6 billion to $1.8 billion, primarily as a result of investment earnings of $275.4 million and contributions of $36.3 million, offset by $95.7 million of grants and expenses. Despite the economic decline, the board authorized grants of $79 million in 2009. We also continue to focus on minimizing our administrative expenses, which totaled 0.7 percent of average assets for the year.
Financial markets remained quite volatile during the first three quarters of 2010: a first-quarter rally, a second-quarter downturn, and another surge in the third quarter. Overall, through Sept. 30, the S&P 500 index rose 3.89 percent, and the Barclay’s Aggregate index was up 7.95 percent.
The Cleveland Foundation’s investment portfolio performed very well during this period of volatility. For the first three quarters, the foundation’s composite return was 6.2 percent, about even with the median institutional-investment composite return of 6.14 percent. Our assets at Sept. 30 remained at $1.8 billion, as grants and expenses offset year-to-date investment earnings and contributions.
We continue to diversify our portfolio under the oversight of our Investment Committee. We believe a well-diversified portfolio, managed by quality asset managers and trust banks, is the best way to navigate through continuing market turbulence.
In closing, I’d like to recognize J.T. Mullen, who retired as chief financial officer of the Cleveland Foundation in 2010 after 23 years of service. I am very proud to have joined the foundation team as CFO, and am happy to be back in my hometown after living away for more than 30 years. I am committed to continuing the strong financial performance and strong internal controls that you have come to expect from the Cleveland Foundation.

Kate A. Asbeck
Senior Vice President and Chief Financial Officer
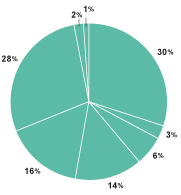
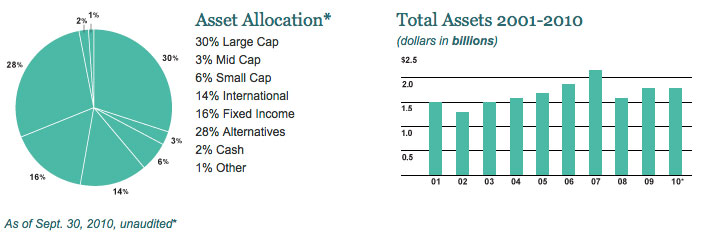
*As of Sept. 30, 2010, unaudited
Asset Allocation*
30% Large Cap
3% Mid Cap
6% Small Cap
14% International
16% Fixed Income
28% Alternatives
2% Cash
1% Other
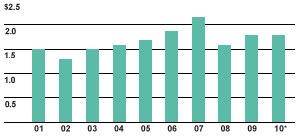
Total Assets 2001-2010
(dollars in billions)
Continue to External Advisors and Banks